Body Mass Index (BMI) is a measurement used to determine whether a person is underweight, normal weight, overweight, or obese based on their height and weight. It is a simple and quick screening tool to assess if an individual is at a healthy weight for their height. BMI range chart is a helpful visual representation that shows where a person falls on the BMI scale.
Understanding your BMI can help you make informed decisions about your health and well-being. It is important to note that BMI is not a perfect measure of health as it does not distinguish between muscle mass and fat mass, but it can be a useful starting point in assessing your weight status.
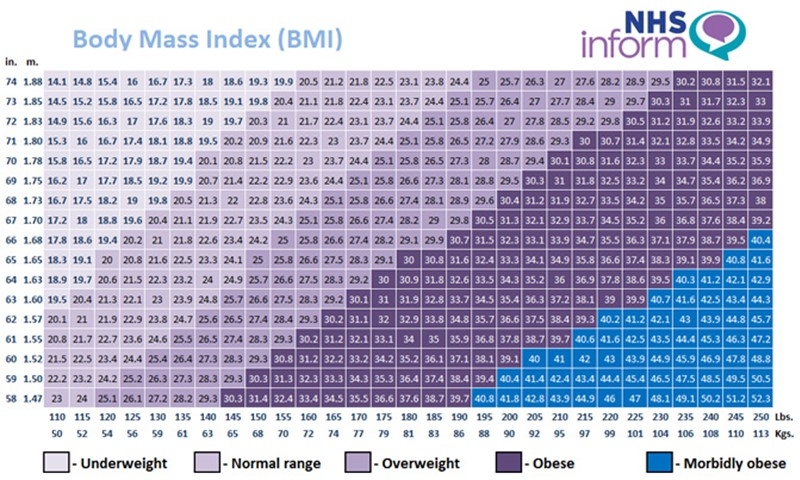
BMI Range Chart
Below is a typical BMI range chart that categorizes individuals into different weight categories based on their BMI:
| Category | BMI Range |
|---|---|
| Underweight | Less than 18.5 |
| Normal Weight | 18.5 – 24.9 |
| Overweight | 25 – 29.9 |
| Obese | 30 or higher |
It is important to remember that BMI is just one indicator of health and should be used in conjunction with other measures such as waist circumference, body fat percentage, and overall fitness level. If you fall into the overweight or obese category, it is advisable to consult with a healthcare provider to discuss a plan for weight management and improving your overall health.
Regular exercise, a balanced diet, and lifestyle modifications can help you achieve and maintain a healthy weight. Remember that everyone’s body is unique, and what works for one person may not work for another. It is essential to focus on overall health and well-being rather than just a number on the scale.
In conclusion, understanding your BMI and where you fall on the BMI range chart can be a valuable tool in assessing your weight status and overall health. It is important to use this information as a starting point in making positive changes to improve your well-being. Remember to consult with a healthcare provider for personalized advice and guidance on achieving a healthy weight.