Gold has always been a popular investment choice for many individuals looking to diversify their portfolios and hedge against economic uncertainty. Over the past two decades, the price of gold has fluctuated significantly, influenced by various factors such as geopolitical events, inflation rates, and market trends.
Understanding the gold chart over the last 20 years can provide valuable insights into the precious metal’s performance and help investors make informed decisions about their investment strategies.
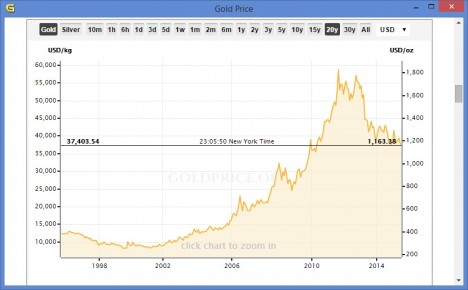
Gold Chart 20 Years
Looking at the gold chart over the past 20 years, we can see a clear trend of price movements that have been influenced by both global economic conditions and investor sentiment. In the early 2000s, gold prices were relatively low, hovering around $300 to $400 per ounce. However, as the financial crisis of 2008 hit, gold prices surged to over $1,000 per ounce as investors sought safe-haven assets.
Following the financial crisis, gold prices continued to rise, reaching all-time highs above $1,900 per ounce in 2011. The precious metal then experienced a period of consolidation before entering a bear market in 2013, with prices dropping to around $1,100 per ounce. In the years that followed, gold prices remained relatively stable, trading within a range of $1,100 to $1,400 per ounce.
More recently, gold prices have seen a resurgence amid the global economic uncertainty caused by the COVID-19 pandemic. As investors flock to safe-haven assets, the price of gold has climbed back above $1,800 per ounce, reflecting growing demand for the precious metal as a store of value.
Looking ahead, it is essential for investors to keep a close eye on the gold market and monitor key economic indicators that could impact prices. Factors such as inflation rates, interest rates, and geopolitical tensions can all influence the price of gold and should be considered when making investment decisions.
In conclusion, the gold chart over the past 20 years illustrates the precious metal’s resilience and appeal as a safe-haven asset during times of economic uncertainty. By staying informed and understanding the factors that drive gold prices, investors can navigate the market effectively and make sound investment choices.